Automating Blackbox Monitoring for your Helm Chart
In this article, I explain the concept of Blackbox Monitoring, a Prometheus CRD for defining monitoring targets, and a possible implementation of these concepts with Helm.

In this article, I explain the concept of Blackbox Monitoring, a Prometheus CRD for defining monitoring targets called Probe, and a possible implementation to automate Blackbox Monitoring of an application deployed via a Helm Chart.
What is Blackbox Monitoring?
Blackbox Monitoring, also known as black-box testing or black-box monitoring, is a type of software testing or monitoring approach that focuses on assessing the external behavior of a system or application without knowledge of its internal structure, logic, or implementation details.
In other words, it treats the system as a "black box" where you can only observe its inputs, outputs, and responses, and monitor the availability and performance of services and endpoints without needing access to their internal details.
What is the Blackbox Exporter?
The Blackbox Exporter is a standalone service that is part of the Prometheus monitoring and alerting ecosystem. It is designed to perform black-box testing of network services and applications from an external perspective. The options for probing a monitoring target range from the use of HTTP, HTTPS, DNS, TCP, ICMP, and gRPC.
You can install the Blackbox Exporter using the official Helm Chart provided by the Prometheus Community as shown here:
# add the official Prometheus Helm Repository
helm repo add prometheus-community https://prometheus-community.github.io/helm-charts

# update the list of available Helm Charts
helm repo update

# install the Blackbox Exporter with the default configuration into the monitoring Namespace
helm install --namespace monitoring prometheus-blackbox-exporter prometheus-community/prometheus-blackbox-exporter
After successful installation, the Blackbox Exporter is configured using a configuration file and command-line flags and supports hot reloading of its configuration file at runtime. Instead of defining the configuration file yourself you can define endpoints and targets for the Blackbox Exporter by using a Custom Resource Definition called Probe, which is provided by the Prometheus Operator.
Including such a Probe resource into your Helm Chart automates the process of adding your application to the Blackbox Exporter configuration.
The Probe CRD
In the context of the Prometheus Operator, a Probe typically refers to a configuration that defines how Prometheus should scrape or probe a specific target (such as a service or endpoint) for metrics. It specifies details such as the target to scrape, the HTTP endpoint to access, and other relevant settings. A very basic example is given here:
apiVersion: monitoring.coreos.com/v1
kind: Probe
metadata:
  name: probe
spec:
  module: http_2xx
  prober:
    path: /probe
    url: blackbox-exporter:9115
  targets:
    staticConfig:
      static:
        - https://myendpoint.com
It tells the prober - in this case a running instance of the Blackbox Exporter - the list of targets to be probed by the Blackbox Exporter and how to perform the probe. The http_2xx module tells the exporter to make a GET request and to expect a 200 OK response.
Helm Templates
Now that we know what Blackbox Monitoring and the Blackbox Exporter is, and that we need to define a Probe for our application endpoints, we can start creating Helm Templates.
The Probe Template
A Probe requires at least a module, a prober, and a list of targets. From the specification of the Probe, that I have linked above, you can see that there are of course much more options and configurable attributes than I'm showing in this example, but I think you'll get the point. A link to a full implementation can be found at the end of the article and on my GitHub repository.
apiVersion: monitoring.coreos.com/v1
kind: Probe
metadata:
  name: probe
spec:
  module: {{ .Values.blackbox.probeSpec.module | quote }}
  prober:
    path: {{ .Values.blackbox.probeSpec.prober.path | quote }}
    url: {{ .Values.blackbox.probeSpec.prober.service }}.{{ .Values.blackbox.probeSpec.prober.namespace }}.svc:{{ .Values.blackbox.probeSpec.prober.port }}
  targets:
    staticConfig:
      static:
        - "http://{{ include "automating-blackbox-monitoring-for-your-helm-chart.fullname" . }}.{{ .Release.Namespace }}.svc:{{ .Values.service.port }}"
        - "https://{{ .Values.ingress.hostname }}"
{{- end }}
The Helm Template contains two targets: the name of the Service and the hostname of the Ingress resource created by the Helm Chart. The following values.yaml contains the attributes that can be used to configure the Probe.
blackbox:
  enabled: true
  probeSpec:
    # -- The module to use for probing specifying how to probe the target.
    module: "http_2xx"
    # -- Specification for the prober to use for probing targets.
    prober:
      # -- Namespace where the Blackbox Exporter service is running.
      namespace: "monitoring"
      # -- Path to collect metrics from.
      path: "/probe"
      # -- Port that the Blackbox Exporter service is exposing.
      port: 9115
      # -- Name of the Blackbox Exporter service.
      service: prometheus-blackbox-exporter

ingress:
  hostname: myapplication.com

service:
  port: 8181
The NetworkPolicy Template
If you are using Network Policies in your cluster - which I highly recommend - you will also need to allow network communication between the Blackbox Exporter and your application. To do this, we need to allow incoming traffic because the Blackbox Exporter is calling the targets.
apiVersion: networking.k8s.io/v1
kind: NetworkPolicy
metadata:
  name: blackbox-exporter
spec:
  ingress:
    - from:
        - namespaceSelector:
            matchLabels:
              kubernetes.io/metadata.name: {{ .Values.blackbox.probeSpec.prober.namespace | quote }}
      ports:
        - port: {{ .Values.blackbox.probeSpec.prober.port }}
          protocol: TCP
  podSelector: {}
  policyTypes:
    - Ingress
From the values.yaml, we can use the port and namespace of the Blackbox Exporter, which has already been defined for the Probe. For further improvement, you could add a PodSelector that only targets the Pods created by your Helm Chart. This is also shown in the full implementation, which can be found at the end of the article and on my GitHub repository.
Metrics of the Blackbox Exporter
Once you have included these templates in your Helm Chart, you will find the corresponding metrics for your application in Prometheus. Running the Blackbox Exporter against a list of targets will generate metrics for each of the endpoints. The resulting metrics will look something like this:
# HELP probe_dns_lookup_time_seconds Returns the time taken for probe dns lookup in seconds
probe_dns_lookup_time_seconds 0.002117601
# HELP probe_duration_seconds Returns how long the probe took to complete in seconds
probe_duration_seconds 0.20882823
# HELP probe_failed_due_to_regex Indicates if probe failed due to regex
probe_failed_due_to_regex 0
# HELP probe_http_content_length Length of http content response
probe_http_content_length -1
# HELP probe_http_duration_seconds Duration of http request by phase, summed over all redirects
probe_http_duration_seconds{phase="connect"} 0.004077029
probe_http_duration_seconds{phase="processing"} 0.105789913
probe_http_duration_seconds{phase="resolve"} 0.002117601
probe_http_duration_seconds{phase="tls"} 0.091883995
probe_http_duration_seconds{phase="transfer"} 0.004295697
# HELP probe_http_redirects The number of redirects
probe_http_redirects 0
# HELP probe_http_ssl Indicates if SSL was used for the final redirect
probe_http_ssl 1
# HELP probe_http_status_code Response HTTP status code
probe_http_status_code 200
# HELP probe_http_uncompressed_body_length Length of uncompressed response body
probe_http_uncompressed_body_length 44410
# HELP probe_http_version Returns the version of HTTP of the probe response
probe_http_version 2
# HELP probe_ip_addr_hash Specifies the hash of IP address. It's useful to detect if the IP address changes.
probe_ip_addr_hash 1.74789895e+09
# HELP probe_ip_protocol Specifies whether probe ip protocol is IP4 or IP6
probe_ip_protocol 4
# HELP probe_ssl_earliest_cert_expiry Returns last SSL chain expiry in unixtime
probe_ssl_earliest_cert_expiry 1.711151999e+09
# HELP probe_ssl_last_chain_expiry_timestamp_seconds Returns last SSL chain expiry in timestamp
probe_ssl_last_chain_expiry_timestamp_seconds 1.711151999e+09
# HELP probe_success Displays whether or not the probe was a success
probe_success 1
# HELP probe_tls_version_info Returns the TLS version used or NaN when unknown
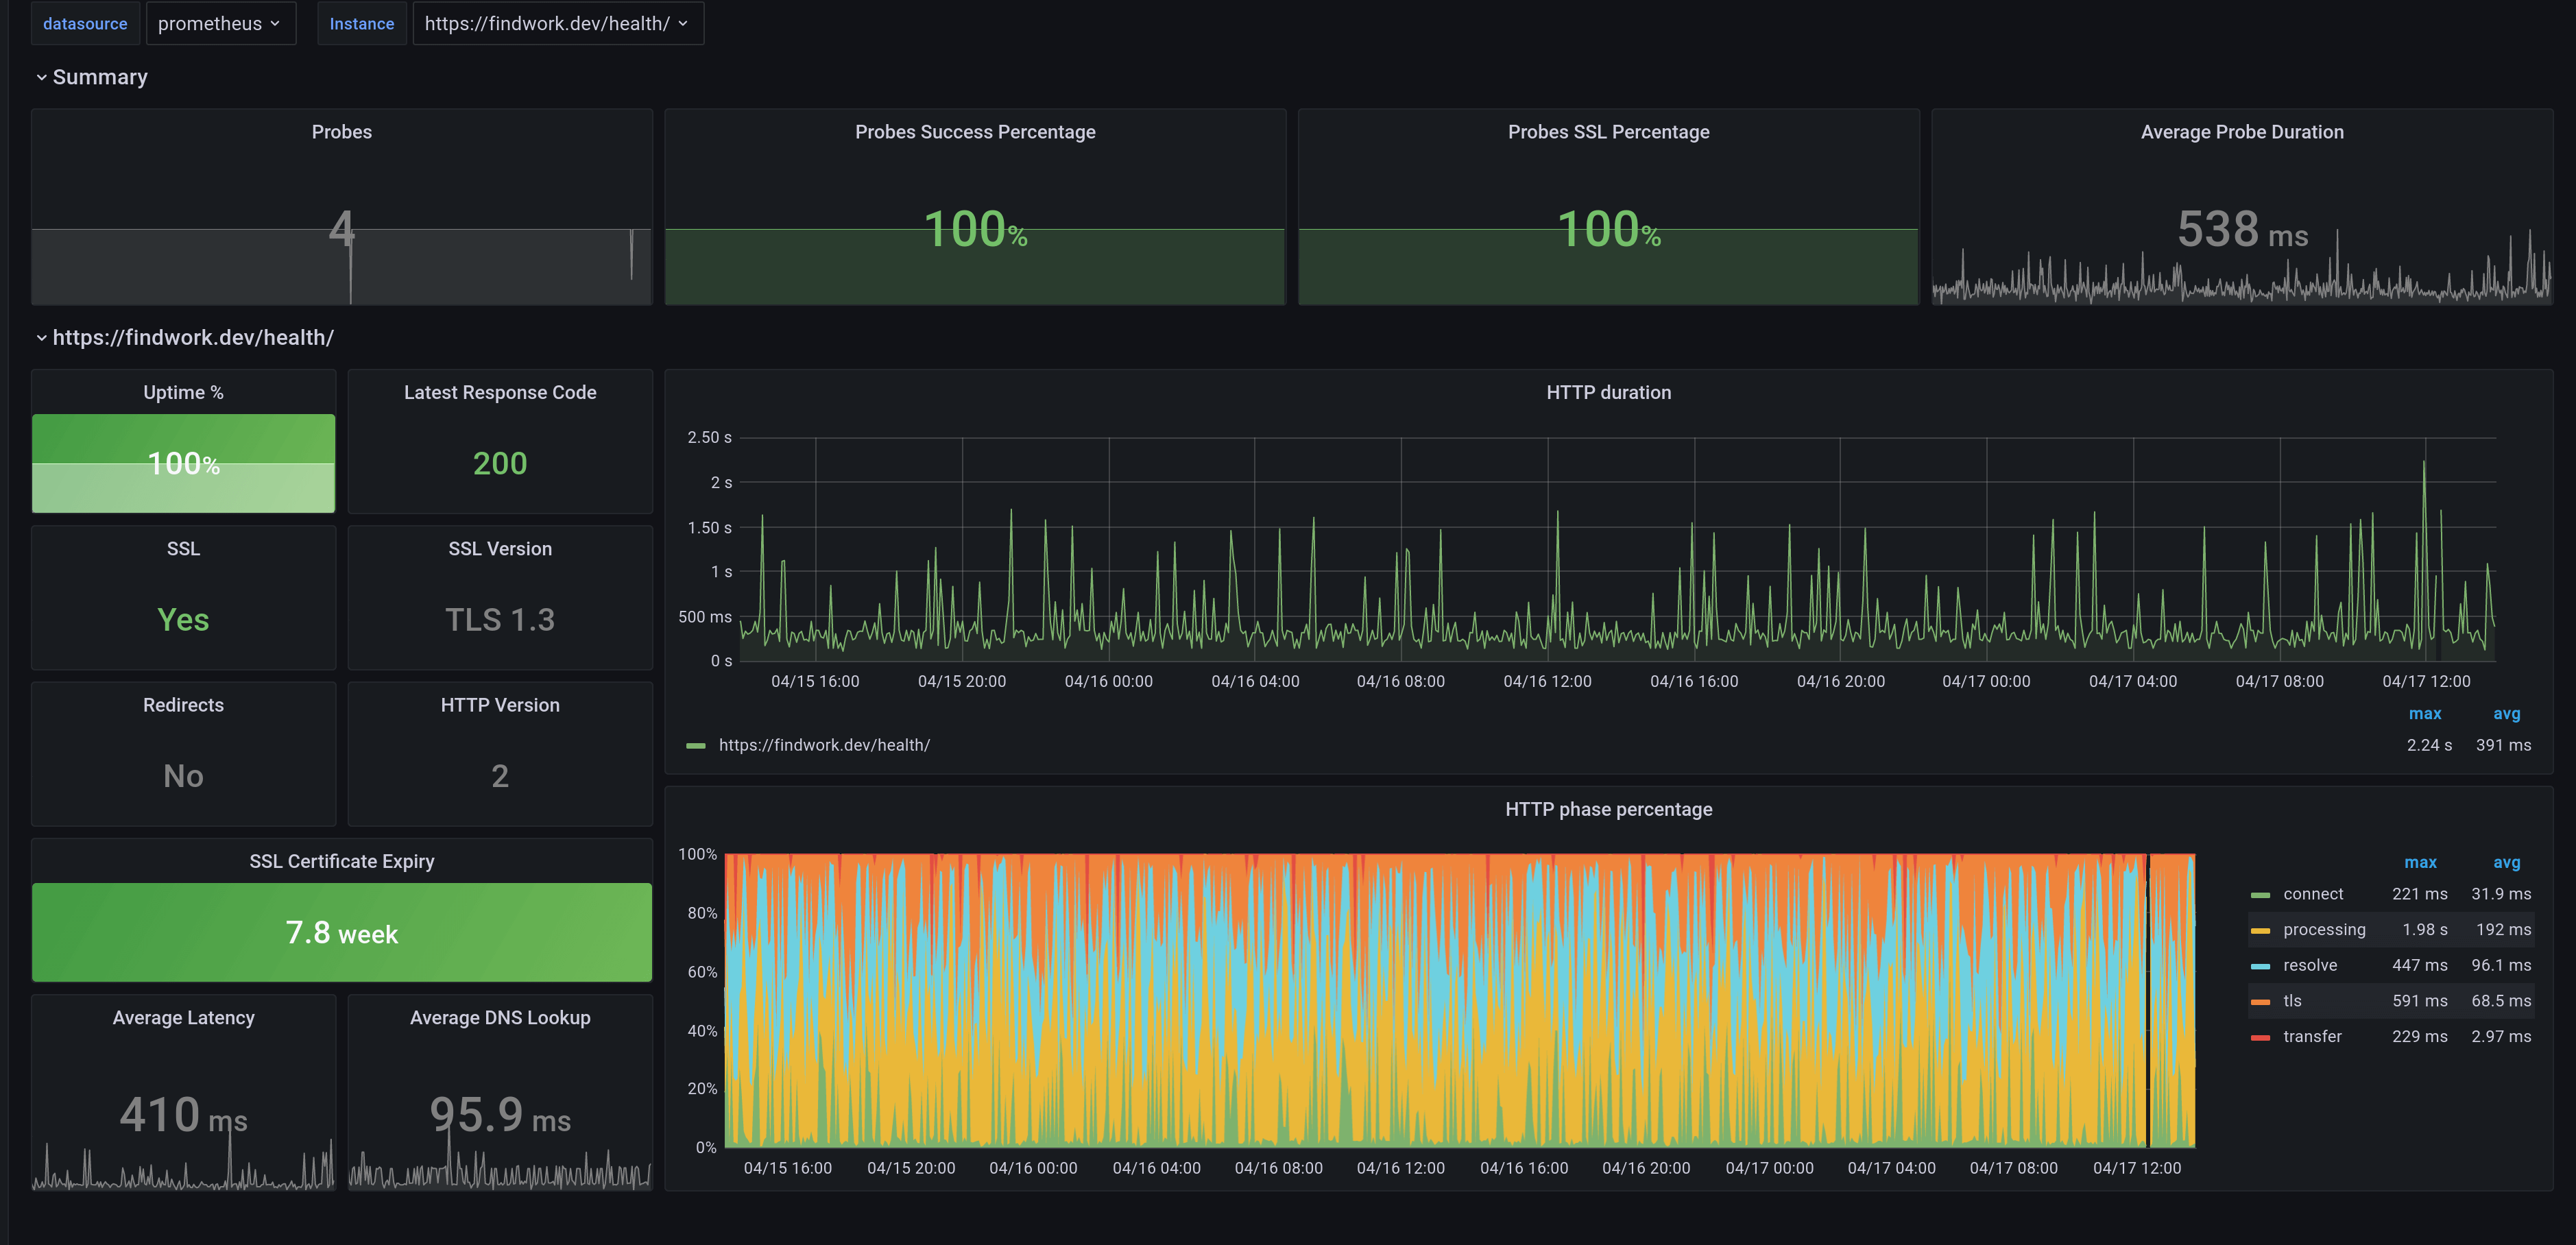
probe_tls_version_info{version="TLS 1.3"} 1The metrics show a lot of information, starting with whether the probe was successful or not (probe_success), whether the endpoint is SSL secured (probe_http_ssl), how long the DNS lookup took (probe_dns_lookup_time_seconds) and much more.
Of course, there are many Grafana dashboards, that can be used to visualize these metrics. You can see a list of them all here.
Wrap up
By adding these Templates to your Helm Chart, users can create a Probe for your application's Service and Ingress resource, automating Blackbox Monitoring.
Want to know more about Helm? Check out my other blog articles at https://blog.knell.it/tag/helm or my instructor-led courses: